|
|
Introduction
|
|
Decibel scales are used in many branches of science and engineering
as a way to measure derived physical quantities like force and power.
In the field of acoustics, derived quantities include the
pressure, power, and intensity of sound waves.
In the field of electronics, derived quantities include electrical
voltage and power.
Here's a quick review of sound power, intensity and pressure :
- SOUND POWER :
Sound power measures the acoustic energy
radiated per second by a sound source.
Sound power is measured in watts ( W )
and is a property of the sound source, independent of the surrounding
space.
One watt equals one joule of energy per second.
- SOUND INTENSITY :
Sound intensity measures the power passing through a unit of
perpendicular area at a particular location in a sound field, distant
from the sound source.
Sound Intensity is measured in watts per square
meter ( W / m 2 ).
- SOUND PRESSURE :
Sound pressure measures the force of a sound wave on a
unit of perpendicular area at a particular location in a sound field,
distant from the sound source.
The old, CGS (centimeter-gram-second) unit of pressure is the dyne per
square centimeter ( dyn / cm 2 )
which also equals one microbar ( μbar ).
The standard international ( SI ) unit of pressure is the pascal ( Pa ).
One pascal equals one newton of force per square meter of area :
1 Pa = 1 N / m 2
= 10 μbar
|
|
Sound Pressure
|
|
This article begins with pressure because Sound Pressure Level
( SPL ) may be the most widely known measurement expressed in decibels.
Sound pressure is what vibrates our eardrums. It has a
strength proportional to the amplitude of the
pressure wave that we call sound. “ Amplitude ” measures the breadth of the back-and-forth
displacement of the air particles that make up the pressure wave.
Sound pressure is a deviation from the surrounding atmospheric
pressure, and its amplitude decreases with its distance from the sound source.
The standard unit of pressure is the pascal,
abbreviated ‘ Pa ’ in honor of Blaise Pascal.
▶
Pascal ( 1623 - 1662 ) was a French mathematician, physicist,
inventor, philosopher, and Catholic writer. He laid the
foundation for the modern theory of probabilities and also invented the
syringe and the hydraulic press.
Sound Speed
In the air, audio-frequency pressure waves are measured using
microphones. Specially constructed hydrophones
are used to measure audio-frequency pressure waves underwater.
In water, sound waves travel faster than they do in air –
1500 meters/sec instead of 340 meters/sec.
The faster speed is due to water's thicker density.
In
air, sound waves travel slower
at higher altitudes where the air density is thinner due to
gravity. Temperature, too, affects the density of materials.
⚡
The speed ( c )
of any wave equals its frequency ( f )
times its wavelength ( λ ):
|

|
[ 1 ]
|
|
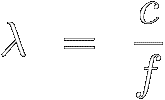
So, its wavelength equals
its speed divided by its frequency :
|
|
[ 2 ]
|
|
Equation [2] shows that when the speed (c)
of a wave increases, so does its wavelength (λ).
For example, when a sound wave having a frequency of 20 hertz moves from
the air to the sea, it's wavelength
increases from 17 meters ( 340 / 20 ) to
75 meters ( 1500 / 20 ).
▶ Heinrich Hertz ( 1857 - 1894 ) was a German
physicist and experimentalist who first conclusively proved the
existence of electromagnetic waves.
In honor of his work, the cycle-per-second — the
unit of frequency — is named a hertz, abbreviated Hz.
Airwaves
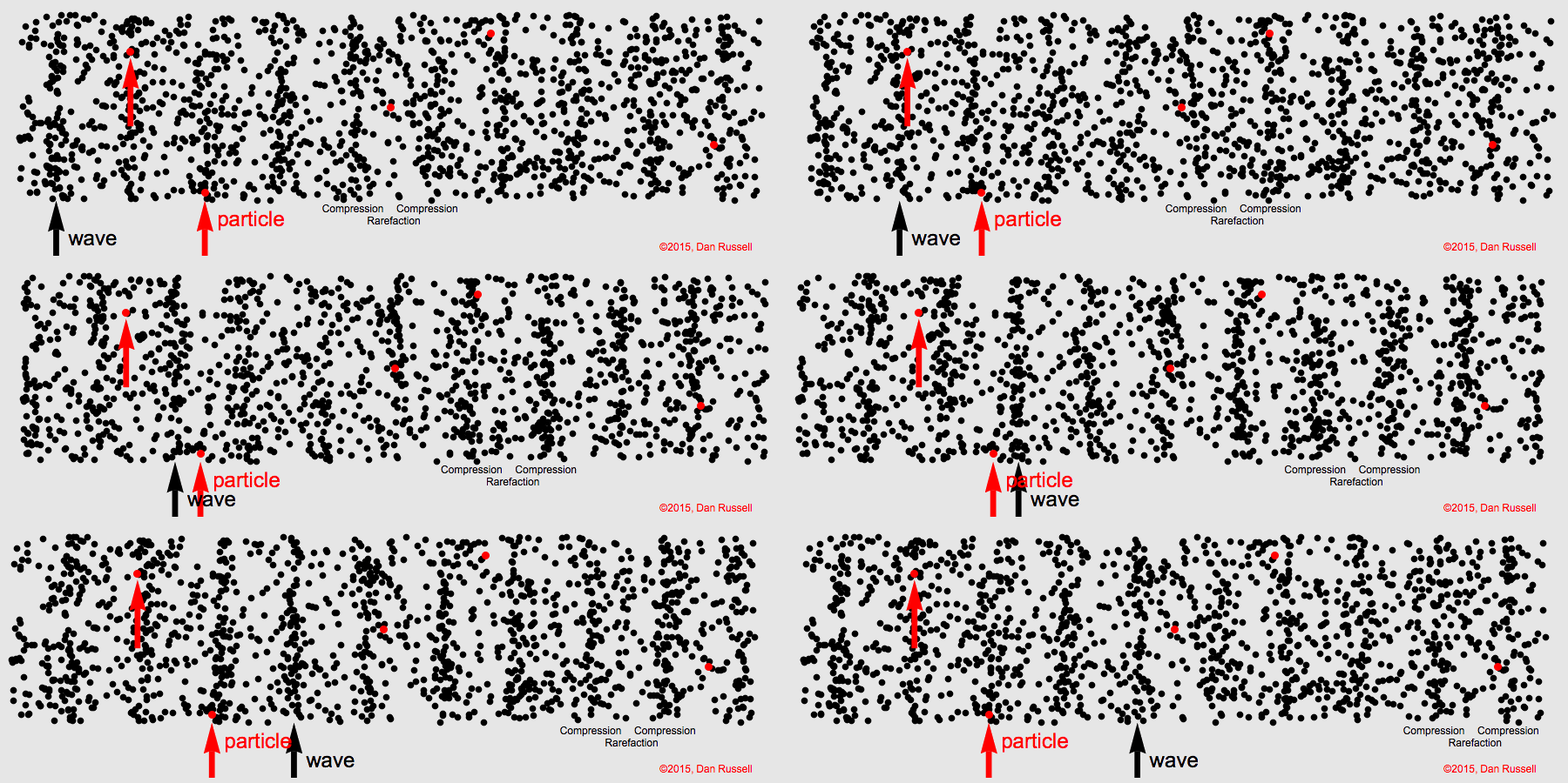
Sound pressure is transmitted by air particles
mechanically vibrating forward and back, causing waves of
air compression and rarefaction.
Humans can perceive sound
waves having frequencies between about 20 Hz and 20,000 Hz (20 kHz).
Sound waves are longitudinal—that
is, each air particle's displacement is parallel to the wave's
propagation. This is unlike
transverse ocean waves, where water particles move vertically
and waves propagate horizontally.
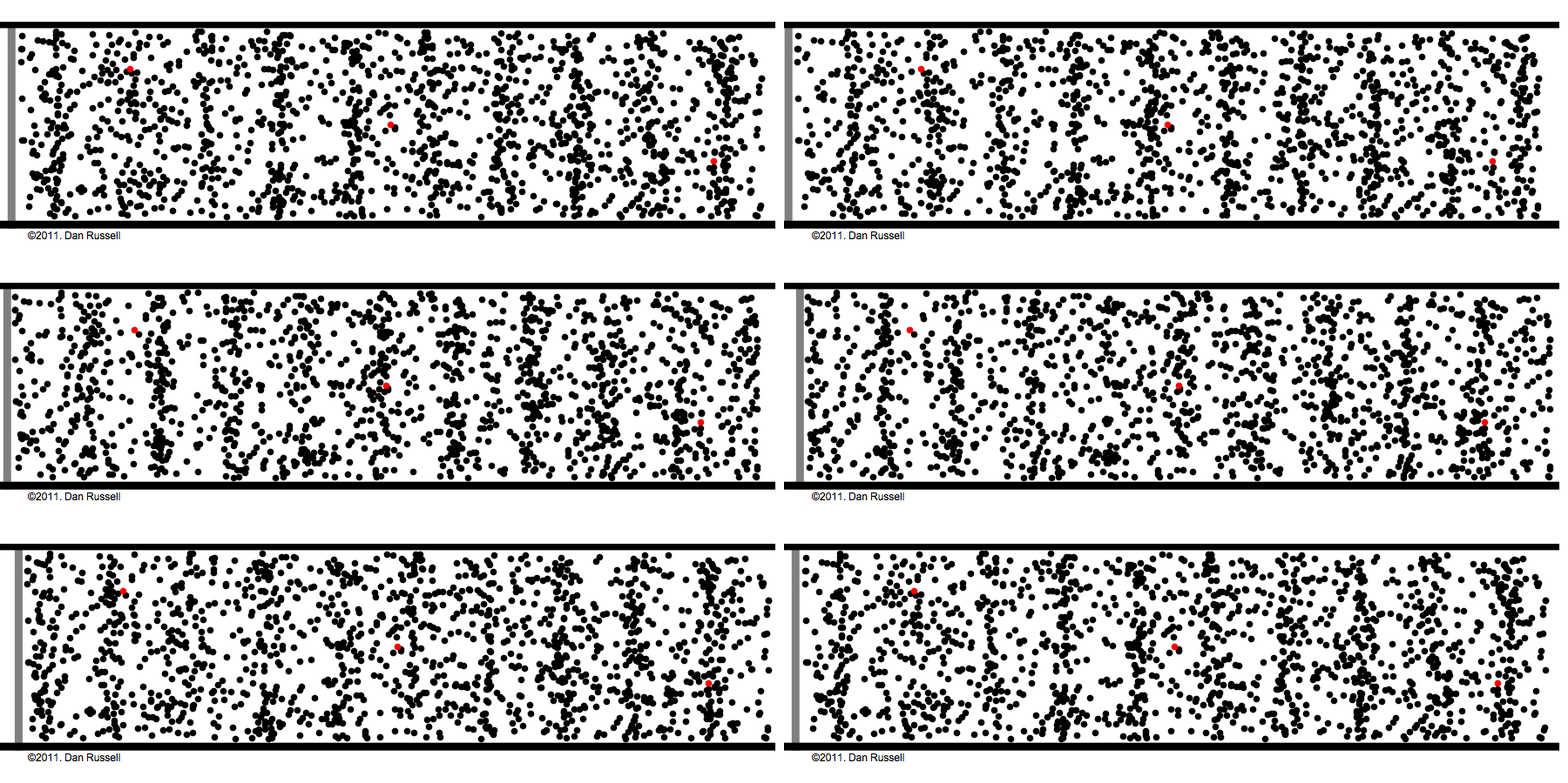
The following animations show how air particles simply move back and
forth about their equilibrium positions while a wave of compression
travels from left to right.
Click animation to enlarge it
|
|
|
The Absolute Threshold
of Hearing
|
|
The very faintest 1 kHz tone that our ears can perceive is often
used as a reference level when expressing sound pressure, intensity, or power.
This reference level is called the “Absolute Threshold of Hearing” ( abbreviated
ATH ).
Although a person's actual threshold of hearing varies with the person's age
and other factors, the following standard values have been adopted for a 1 kHz sound wave :
ATH Power :
W 0 = 10 -12
watts = 1 picowatt ( pW )
ATH Intensity :
I 0 = 1 picowatt per square
meter ( pW / m 2 ).
ATH Pressure :
p 0 = 20 micropascals
( μ Pa )
= 0.0002 microbar ( μ bar ) or dyn / cm 2
◼ The ATH sound pressure is about ten one-billionths of the standard
atmospheric pressure ( 1 atm = 101,325 Pa ). One atm is approximately equal to Earth's average atmospheric pressure at
sea level..
◼ The ATH sound pressure roughly compares to
that of a mosquito flying 10 feet ( 3 m ) away,
having air particle displacements on the order of a tenth of an atomic diameter.
Exponential Sensitivity
At the LOUD extreme of our hearing lies the threshold of
pain, whose
pressure at 1 kHz has been standardized to 20 pascals —
that's one million ( 10 6 ) times greater than the
20 μPa pressure at the threshold of hearing.
In terms of power and intensity, the threshold of
pain is roughly a trillion ( 1012 =
1,000,000,000,000 ) times greater than their respective ATH levels.
This gigantic numeric range speaks to the exponential
sensitivity of our hearing.
A convenient way to express both huge and tiny numbers along a single, compact
scale is to use logarithmic ratios.
Ratios make the numbers dimensionless and thus applicable to a
wide variety of physical quantities and reference levels.
Logarithms squeeze more and more numbers into each scale
division by bunching the scale into powers of ten, each subdivided
exponentially :
A Logarithmic Scale
Logarithms also simplify ratio multiplications by
turning them into additions.
Moreover, logarithmic scales roughly align with the psychoacoustics of
human hearing.
|
|
The Bel |
|
The convenient, logarithmic sound ratio is named the ‘bel’, abbreviated capital B for
Alexander Graham Bell (1847-1922), a Scottish-born Canadian-American inventor
and engineer remembered for his work in sound technology and education for the deaf.
A more commonly used value is the decibel, abbreviated
dB. One decibel is one tenth of a bel :
10 decibels = 1 bel
Logarithms
Since decibels use logarithms, let's quickly review what the
base-10 logarithm ( or log ) of a number is.
It's simply the power ( or
exponent ) of 10 that produces that number.
For example, if the number is 100 then the power of 10
is 2 :
100 = 10 2
So,
log 10 (100) = 2
Other powers of ten aren't so obvious. For example, if the number is 2, then the power of 10 is almost
exactly 0.30103 because :
2 ≅ 10 0.30103
So, to a very close approximation,
log 10 (2) = 0.3
★ If you're wondering how 10 can be multiplied by itself a
non-whole number of times, it can't.
But exponent math, graphs, tables and slide rules have long been used to
calculate or interpolate
the values of non-whole powers of ten.
Today, you can type any non-whole number into a pocket
calculator or cell phone and press the [ 10 x ]
button. Calculator algorithms give excellent results for any
power of 10. You can also use the [ LOG ] button to display the
log of any number, for example ‘2’ .
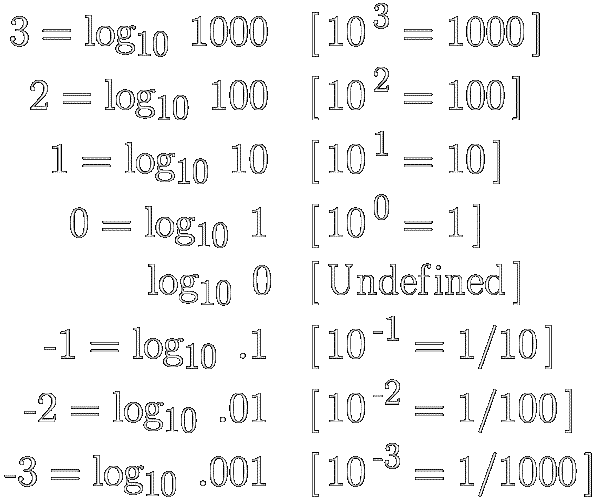
Here are a few clear-cut examples of whole-number logarithms :
|
|
[ 3 ]
|
|
●
Notice that “log10 (2)” must fall
somewhere between 0 and 1. (A good first guess would be 0.3.)
Why Does 10 0 = 1 ?
Raising a number to the power of zero means multiplying that
number by itself zero times. But that means not multiplying
by anything, which is the same as multiplying by ‘1’, the
multiplicative identity. ‘1’ times anything doesn't change
anything.
Why is log10 ( 0 ) Undefined ?
Because you can never get a result of zero by raising any number except zero to
any power whatsoever.
|
|
Definition of Bel & Decibel |
|
The bel and decibel are dimensionless measures of the ratio
of two values. As such, they communicate a comparison
of values
or a gain / loss.
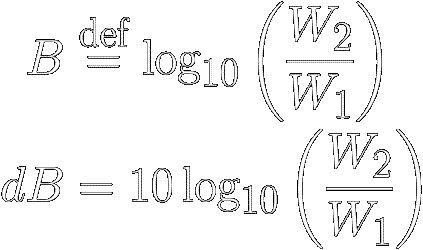
A bel ( abbreviated B)
is defined as the logarithm
of the ratio of two
power quantities,
W2 and W1 :
|
|
[ 4 ]
|
|
Notice that there are 10 decibels
[dB] in one bel [B].
● A 10-fold gain in power
[W2 = 10 W1] equals
1 bel or 10 decibels since log 10 = 1.
● A 100-fold gain is 20 decibels, a thousand-fold gain
is 30 decibels and a million-fold gain is 60 decibels.
● A doubling of power is about 3 dB since log 2 ≅ 0.30103.
● If W2 = W1,
the gain is 0 dB since log 1 = 0.
▶ We often write the log operator without using the subscript ‘10’.
That's because logs to the base 10, also called "common" logs, are commonly
called "logs".
The only other log base regularly used is ‘e’, an irrational
and transcendental number used in higher math. Logs to the base e, also
called "natural" logs, are commonly denoted by the symbol
Ln, not by Log e .
★ Because decibels are exponents,
multiplying them is additive not multiplicative.
For example, a 3 dB signal passing through an amplifier having a
gain of 2 dB yields a 5 dB signal :
103 × 102 = 105
1000 × 100 = 100,000
Sound Power & Intensity
Although decibels express a ratio of two power
levels, they can also communicate a specific power level if the
ratio is made to a specific, reference power.
A commonly used reference power is that of a sound at the
Absolute Threshold of Hearing
(W0 = 1.0 picowatt).
Using this reference, the "Sound Power Level"
(abbreviated LW or SWL) of
a wattage ‘W’ can be expressed in decibels
as :
|

|
[ 5 ]
|
|
Where:
W = an absolute sound power in watts
W0 = the ATH reference sound power ( = 1 pW )
LW = SWL = the absolute sound power in decibels
The 10 multiplier appears because there are 10 decibels in a bel.
A specific (or absolute) sound intensity ‘I’
can also be expressed in decibels by comparing the intensity to the ATH reference intensity
(I 0 = 1.0 picowatt per square meter)
This "Sound
Intensity Level" is abbreviated LI or SIL :
|

|
[ 6 ]
|
|
Where:
I = an absolute sound intensity in watts per square meter
I 0 = the ATH reference sound intensity
( = 1 p W / m 2 )
L I = S I L = the
absolute sound intensity in decibels
The 10 multiplier appears because there are 10 decibels in a bel.
Root-power Quantities
Measurement quantities fall into two categories: power
quantities and root-power quantities.
A power quantity is directly
proportional to power or energy.
A root-power quantity must be
squared to be proportional to power or energy.
They're proportional to the
square root of a power quantity.
The following table lists various power and root-power quantities :
|
|
|
POWER QUANTITIES
( Directly proportional to energy or power ) |
|
Power (Energy per second) |
|
Power Density (Power per volume) |
|
Energy Density (Energy per volume) |
|
Acoustic Intensity (Power per area) |
|
Luminous Intensity (Power per steradian) |
ROOT-POWER QUANTITIES
( Their squares are
proportional to power or energy ) |
EXAMPLES |
|
Sound Pressure p |
Acoustic Intensity = p 2 / Z |
|
Voltage V |
Power = V 2 / R |
|
Current I |
Power = I 2 × R |
|
Speed v, c |
Kinetic Energy = 1⁄2 m v 2
E = m c 2 |
|
Electric Field Strength E |
Power density = E 2 ÷ 377 |
|
Magnetic Field Strength H |
Power density = H 2 × 377 |
|
The above table shows that sound
pressure
and electric voltage
are root-power quantities.
Decibels, however, are
defined in terms of power quantities.
So, in order to conform to the decibel scale, pressures and voltages must
always be squared when calculating decibels.
Decibels for
Pressure & Voltage
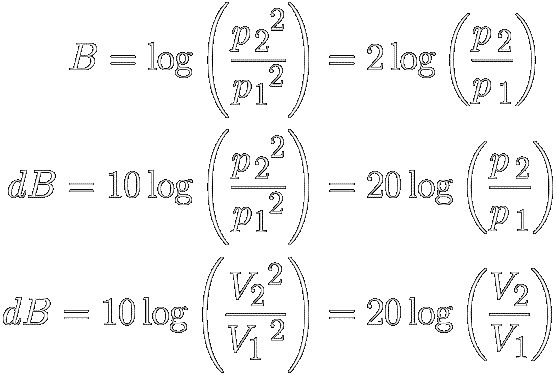
Since sound pressure (p)
and electric voltage (V)
are root-power quantities, their values must be squared
when calculating bels (B) and
decibels (dB). For example :
|
|
[ 7 ]
|
|
● A 10-fold gain in voltage or pressure
[p 2 = 10 p1]
equals 2 bels (or 20 decibels) since log(10) = 1.
● A 100-fold gain is 40 decibels, a
thousand-fold gain is 60 decibels and a million-fold
gain is 120 decibels.
● A doubling of
voltage or pressure is about 6 dB since log 2 ≅ 0.30103.
Log Arithmetic
● Equations [7] take advantage of the following identity :
x n / y n = ( x / y )n
For example, suppose x = 10,
y = 5
and n = 2 :
100 / 25 = ( 10 / 5 )2
4 = 4
● They also take advantage of the following identity :
log x n = n × log x
For example, suppose x = 10
and n = 2 :
log ( 100 ) = 2 × log ( 10 )
2 = 2 × 1
|
|
SPL — Sound Pressure Level
|
|
We now have the wherewithal to communicate a specific
Sound Pressure Level (abbreviated
SPL or Lp)
in decibels rather than pascals.
Just replace p1 in equation
[ 7 ] with the
ATH reference pressure
(p 0 = 20 micropascals)
and replace p2 with p:
|

|
[ 8 ]
|
|
Where:
p = an absolute sound pressure in pascals
p 0 = the ATH reference sound pressure ( = 20 μPa )
L p = SPL = the absolute sound pressure level in decibels
Sound Pressure Levels are commonly used to rank sound levels in the environment. Shown
below is a list of Sound Pressure Levels,
in decibel order, along with some sound sources that produce those
pressure levels.
|
|
S o u n d P r e s s u r e L e v e l s
( Lp ref 20 μ Pa ) |
|
dB SPL |
Sound Source Examples |
|
0 |
"THRESHOLD OF HEARING"
Mosquito flying 3 m away |
|
10 |
Rustling leaves in the distance • Light wind
Calm breathing • Ticking watch |
|
20 |
Unoccupied TV studio • Whisper 1 m away |
|
30 |
Woods • Quiet bedroom at night |
|
40 |
Quiet library • Light rain • Computer hum |
|
50 |
Average suburban home • Quiet office |
|
60 |
Conversational speech 1 m away |
|
70 |
Busy business road 15 m away • Vacuum cleaner 1 m away |
|
80 |
Busy business road 5 m away • Noisy restaurant
Garbage disposal • Freight train 30 m away |
|
90 |
Heavy truck 10 m away • Inside a school bus |
|
100 |
Loud "disco" music 1 m from speaker
Alongside a mainline railway • A nearby motorcycle |
|
110 |
Jet engine 100 m away • Jackhammer 10 m away
Chainsaw 1 m away • Rock music venue (front row) |
|
120 |
"THRESHOLD OF DISCOMFORT"
Large jet taking off 300 m away • Loud car horn 1 m away
Ship's engine room • Hard rock concert |
|
130 |
"THRESHOLD OF PAIN"
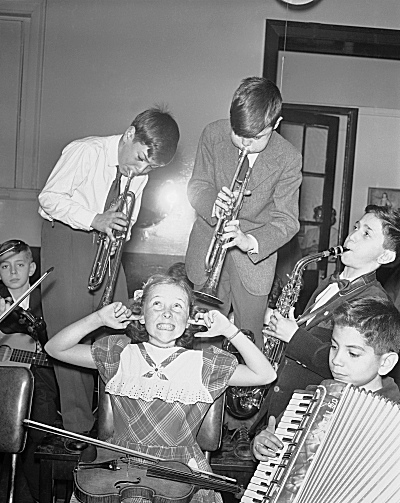
Trumpet 0.5 m away • Pneumatic drill nearby
Loudest human voice 1 inch away |
|
140 |
Large jet aircraft taking off 50 m away • Colt 45 pistol 8 m away |
|
150 |
Jet engine 1 m away • M-80 firecracker close up |
|
160 |
Fighter jet taking off nearby • Shotgun close up |
|
170 |
Stun grenade • Space shuttle launch |
|
310 |
Pressure wave from the Krakatoa eruption in 1883 |
|
|
|
|
|
dB Suffixes
|
|
Next, we'll go over a few of the dB suffixes that are commonly used in
audio and electronic measurements.
The dBm
The ‘ dBm ’ is a
logarithmic power
ratio relative to one milliwatt :
0 dBm = 1 mW
By substituting 1 mW for W1 in the decibel definition
[ EQ 4 ], you can see that
a power of
10 mW = 10 dBm, 100 mW = 20 dBm, 1000 mW = 30 dBm, etc.
The signal strength being
received by a cell phone is often given in dBm
in the phone's SIM card status settings [see photo].
Note: “asu” is an “arbitrary strength unit” whose scale varies
with the network generation.
The dBm is also used to report Wi-Fi or cable connection strengths.
Since the power of cellular and Wi-Fi signals is less
than one milliwatt, their dBm values are negative numbers ( refer
to EQ 3 ).
Excellent phone signals can range from −50 dBm to −80 dBm.
Poor signals can register as low as −120 dBm or less.
The actual values depend on the phone's sensitivity and the cellular
network's generation.
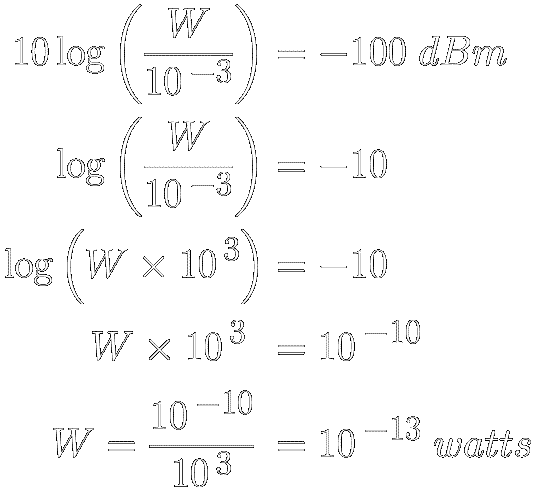
To get a feeling for these dBm values, let's use the decibel
definition
[ EQ 4 ]
to calculate what the above −100 dBm signal strength is, in watts
(W).
Remember, the dBm reference level is 1 mW or 10−3 watts :
|
|
[ 9 ]
|
|
So, a signal strength of −100 dBm is 10−13
watts, 10−10 milliwatts or 0.1 picowatts
(1 pW = 10−12 watts).
● The dBm is also used to
express signal power levels in mixing
consoles, tape recorders, and other audio gear.
The dBu
In The Beginning…
The ‘dBu’, formerly
known as the ‘dBv’,
has its roots in the time of Alexander Graham Bell and the telephone industry that standardized
the 600-ohm telephone line that's still in use today.
|
|
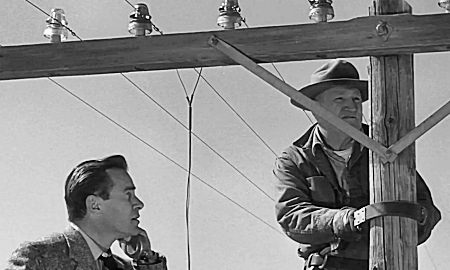
"It Came From Outer Space"
|
|
In order to measure power losses in telephone lines, vintage
voltmeters often had a decibel scale marked “ dBm ” even though
the dBm is a power measurement not a voltage measurement.
The dBm scale that's printed onto vintage voltmeters acts to convert a
voltage into its power equivalent but only if the tested voltage
is across an impedance of 600 Ω.
Only then will the meter's scale graduations correctly convert the voltage.
Today, audio gear has input impedances that are
greatly higher than 600 Ω, making those dBm scales useless.
And besides, at high impedances the main concern is
voltage, not power, since very little power
is needed to pass a voltage signal.
Enter The dBu
So, eventually, a purely voltage-referenced decibel
measurement – the
‘dBu’ – came along.
The dBu is unloaded—it doesn't
presume any particular load impedance—but its voltage-reference
remains true to the
‘ 1 mW @ 600 Ω ’
telephony standard.
So let's calculate the voltage (V)
that corresponds to 1 mW
of power (P) across a 600 Ω
load (R).
We know that electric power P = V × I and
that electric current I = V / R so let's substitute ‘ V / R ’ for the
‘ I ’ in the power equation…
P = V × ( V / R )
= V 2 / R
Then, solving for "V", we find that
V = √(P × R)
Then, to find the dBu voltage reference, we plug 1 mW and 600 Ω
into the above equation :
|

|
[ 10 ]
|
|
◼ So, the dBu
‘reference voltage’ is
0.775 volts.
The Professional Audio Standard
The dBu is the standard voltage quantifier for interfacing pro-audio
gear. The pro-audio interface specifies a balanced
line-level signal of +4 dBu
connected by a balanced 3-wire cable
using XLR connectors.
The ‘XLR’ connector was first introduced in the 1950s by
the Canon Electric Co. ( now ITT Canon ) as
the "XL Series" audio connector.
The name "XLR" stands for "eXternal Line Return".
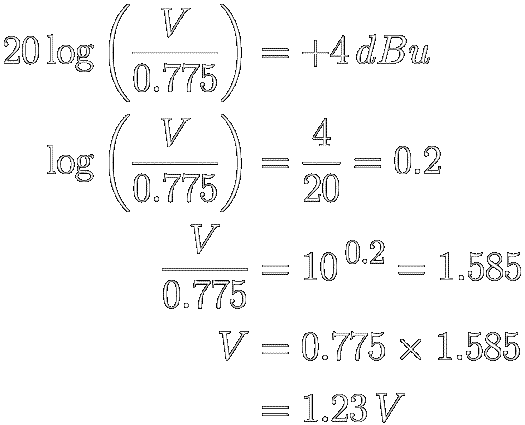
We can calculate the voltage level that corresponds to +4 dBu by using equation
[ 7 ],
the decibel definition for
root-power
quantities.
In the definition, we simply set V2 = V ,
V1 = 0.775 ( the dBu reference
voltage ) and dB = +4. That
gives us :
|
|
[ 11 ]
|
|
◼
So, the +4 dBu
pro-audio line level is 1.23 volts.
The dBu was previously called the dBv (lower case v) but to avoid confusion
with the dBV, which uses a 1.0 V reference, the lower case ‘u’ was adopted.
Occasionally, however, you may find ‘dBv’ still being used
to indicate a 0.775 reference voltage.
The dBV
The ‘dBV’ is a logarithmic voltage ratio
relative to one volt. Like the dBu,
it presumes no particular load impedance.
So, 1 V = 0 dBV. And since voltage is a
root-power
quantity, we use equation
[ 7 ]
to find that 10 V = 20 dBV, 100 V = 40 dBV, 1000 V
= 60 dBV, etc.
The Consumer
Audio Standard
The dBV is the standard voltage quantifier for interfacing consumer
and semi-pro audio gear.
The consumer interface specifies an unbalanced line-level
signal of −10 dbV connected
by an unbalanced 2-wire cable using
RCA connectors ( ‘phono plugs’ ).
This connector was first used by RCA to connect phonograph tonearms to
amplifiers, hence the label ‘phono’ plug.
The plug was so common in RCA equipment that it
became widely known as the ‘RCA’ plug.
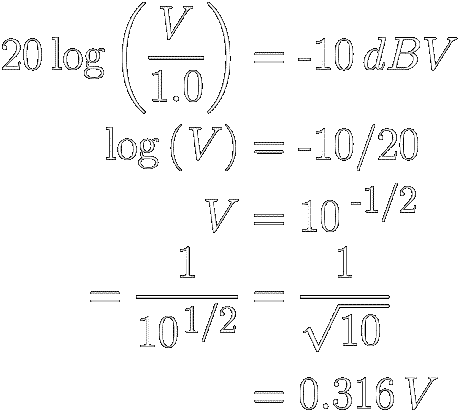
We can calculate the voltage that corresponds to a −10 dBV
line-level signal by using equation
[ 7 ],
the decibel definition for
root-power
quantities.
In the definition, we simply set V2 = V ,
V1 = 1.0 ( the dBV reference
voltage ) and dB = −10. That
gives us :
|
|
[ 12 ]
|
|
◼ So, the −10 dBV
consumer line level is 316 mV.
Pro/Consumer Level Difference
It may be obvious that the level difference between the
+4 dBu professional
standard and the
−10 dBV consumer
standard
is not 14 dB. That's because the two decibel types reference different voltages: 0.775 V for the dBu and 1.0 V for the dBV.
To find the true difference, in decibels, we must compare the absolute voltages
to which +4 dBu and −10 dBV refer.
Calculation
[11]
showed us that +4 dBu = 1.23 volts. Calculation
[12]
showed us that −10 dBV = 0.316 volts.
So, using the decibel definition for voltages
[ 7 ] ,
we find that 1.23 volts is about
12 dB above
0.316 volts :
20 log (1.23/0.316) = 20 log (3.892)
= 20 × 0.590 = 11.8 dB
And, not surprisingly, we find that 0.316 volts is about 12 dB
below
1.23 volts :
20 log (0.316/1.23) = 20 log (0.257)
= 20 × (− 0.590) = −11.8 dB
◼ So, the difference
between the Professional and Consumer line-level voltages is roughly
12 dB.
|
|
VU Meters
|
|
The VU (Volume Unit) meter is a tool for visually gauging the "loudness"
of an audio signal (more about loudness in a moment).
The VU meter's electromechanical ballistics
act to average audio levels over short
periods of time, which simulates how we perceive loudness.
The original VU meters were fitted with a 200 μA d'Arsonval
(moving-coil) DC ammeter fed by a full-wave, copper-oxide rectifier.
► Jacques-Arsène d'Arsonval (1851-1940) was a French physician,
physicist and inventor of the moving-coil galvanometer and
the thermocouple ammeter.
He was also a contributor to
the emerging field of electrophysiology.
The needle of an analog VU meter has a mass that slows down the meter's
response time. Short-duration
signal peaks and troughs are smoothed out, better depicting the perceived loudness of an audio program.
The needle's rise time (the time it takes to reach the level of the sound) and
its fall time (the time it takes to drop to a lower level) are
each about 300 milliseconds.
The VU meter's scale ranges from −20 VU to +3 VU, with −2 VU near
the middle.
0 VU (100%) equals a signal level of +4 dBu (1.23 V),
which is the
pro-audio
line-level standard.
◼ 0 VU is sometimes referred to as 0 dBVU or simply 0 dB.
The VU meter isn't designed to show you peak
volumes but rather to help you guide the average volume to a 100% target.
Electronic and digital VU meters must carefully emulate the VU meter's
original ballistics in order to match the d'Arsonval needle movement.
|
|
Perceived
Loudness
|
|
The "loudness" we perceive from a tone doesn't
correlate with its actual intensity in watts / meter 2.
One reason for this is that our ears' sensitivity depends on a tone's
wavelength.
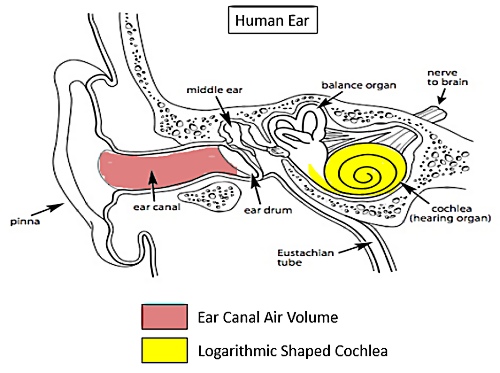
This dependency is largely due to our roughly 2.5 cm long, curved ear canals.
In addition, the
next chart will show that
perceived loudness depends, not only on a tone's frequency, but also on its
pressure level
(SPL).
The tone's SPL helps to determine how much its loudness differs from each of the other frequencies.
In the end, loudness is a subjective
measure obtained statistically by surveying the judgments of a
large number of listeners having normal hearing. In this way,
a “typical listener” is established.
Phons
Loudness surveys use a 1 kHz tone at 60 dB SPL as a reference
loudness that's defined as 60 phons.
60 phons = 60 dB SPL @ 1 kHz
The loudness scale, in phons, numerically tracks the SPL of
the 1 kHz reference tone both up and down from 60 phons.

So, to judge the loudness of a random test tone, the SPL of the reference tone
is adjusted up or down until the two tones sound equally loud.
At that point,
the perceived loudness of the test
tone, in phons, is precisely the SPL of the adjusted reference tone.
Equal Loudness Curves
In the 1930s, equal-loudness curves were
developed by Harvey Fletcher, the “ father of stereophonic sound ”
(left) and Wilden Munson.
As technology has improved, the original curves have been updated.
These so-called "Fletcher-Munson" curves show the relationship of a tone's
perceived loudness to its
frequency and pressure level :
Equal Loudness Curves from ISO 226:2003
Look at the blue, 60-phon loudness curve. It shows that a
1 kHz tone at 60 dB SPL
sounds 60 phons loud. Of course, that's the definition of a phon!
But when you follow the blue curve to the left, you see that a
20 Hz bass tone must be at
110 dB SPL to reach that same
60-phon loudness! Clearly, our hearing is less sensitive to
low-frequency sound waves.
► LOW-FREQUENCY NOTE:
Notice that the louder phon curves rise less steeply in the low
frequency range than do the quieter phon curves. In other
words, the
low-end sensitivity of our hearing gets flatter with increasing loudness.
|
|
Decibel Weighting
|
|
Since some audio frequencies are more important to perceived loudness than are others, it makes sense to overweight them when measuring
sound levels.
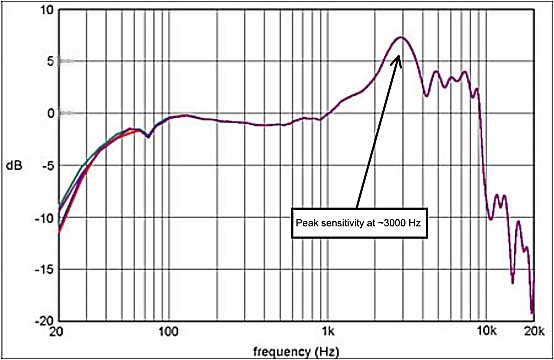
Our ears are most sensitive to frequencies between about 600 Hz and 7 kHz
(especially around 3 kHz). At lower and higher frequencies our ears are
less sensitive, as depicted below :
Hearing Sensitivity Chart
|
This photo by Unknown Author is licensed under
CC-BY-SA

|
|
Equalization Curves
Sound level meters often use frequency
weighting to skew
their sensitivity toward the frequencies to which our hearing is most sensitive.
These meters employ equalization (EQ) curves
to control the degree of emphasis or de-emphasis that's given to various frequency ranges.
Three common EQ curves have been named 'A', 'B' and 'C'.
Whenever an EQ curve is applied to a measurement,
its letter designation is appended to the dB label – for example, dBA, dB(A)
or LpA.
Since our hearing is less sensitive to low
frequencies, all three of these weighting curves de-emphasize the lows :
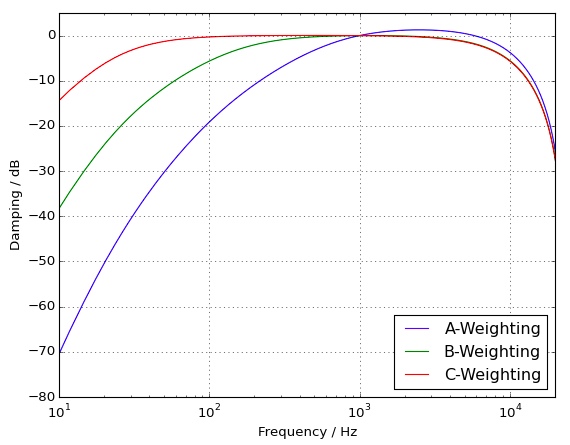
Decibel Weighting
dB(A)
The ‘A’ weighting curve is the most widely used EQ curve. Its aggressive exclusion of low frequencies and its
slight emphasis of the 3 kHz range make it
useful for defining noise regulations.
Though the ‘A’ curve may have some deficiencies, like not falling
off quickly enough above 10 kHz, the dB(A)
is mandated worldwide for hearing damage risk.
The ‘A’ curve is also used to measure the sound pressure level
(SPL) of musical performances.
However, it works best for music having a moderate
volume, without loud low-end frequencies.
dB(C) and dB(B)
Notice how steeply the low frequencies are rolled off by the A-weighted
EQ curve.

By contrast, the C-weighted curve has a moderate low-end cut which
may render a better measure of music having loud bass tones.
That's because, as
mentioned previously, the low-end sensitivity
of our ears gets flatter with increasing loudness.
As a result, ‘C’ weighting can be helpful when monitoring high-SPL
music at shows or in the studio. The ‘C’ curve
is practically linear over many musical octaves.
The ‘B’ curve has a low-end slope
that's midway between the severe cut of the ‘A’ curve and
the minimal cut of the ‘C’ curve.
B-weighting may be best for overall
music listening levels but it has been phased out of
many sound level meters and is seldom used.
|
|
Average Sound Levels |
|
It turns out that our perception of the loudness
of a piece of music depends, not only on which sound frequencies and pressure levels are present,
but also on the music's average sound level,
not on its peak levels.
Sound levels can peak in a fraction of a second but they won't sound
“loud” if the level isn't sustained.
A short burst of a loud high-frequency tone sounds much lower in level to us
than it actually is because it takes time for our
auditory processing system (our hearing)
to become aware of and attach meaning to sounds.
RMS Meters
In the early days of sound technology, mechanical
VU meters
approximated what's called “RMS averaging” to provide an acceptable indication of
program loudness.But toward the end of the 20th century, the limited decibel range
of VU meters – half of the VU scale
displays only 6 dB ! – made them less suited to advanced recording technology.
In the 1980s, electronic RMS meters were developed,
offering scale ranges of 50 dB or more. These meters calculate RMS averages over
a roughly 300 millisecond time span,
similar to the rise and fall time of a VU meter's mechanical needle.
RMS averaging smoothes out any sharp peaks in the audio. As a
result, RMS
meter readings more closely agree with how we perceive loudness.
But, since neither RMS nor VU meters register sudden peaks in audio level, these
meters are often used in conjunction with
peak-level meters or indicators.
RMS Calculation
Recall that the amplitude of the back-and-forth displacement of
air particles
determines the pressure
of the longitudinal acoustic wave propagated through the air.
Likewise, the amplitude of the back-and-forth displacement of
charged particles
(like electrons) determines the voltage
of the longitudinal electric wave propagated through wires and components.
In both of these waves, the particle motion is constantly increasing, decreasing and
reversing direction, like the motion of a swinging pendulum bob.
— AMPLITUDES —
Peak (PK), Peak-to-Peak (PP), and RMS
In order to determine the effective power
(energy / time) of vibrating particles, we must use an
average amplitude that, over time, would deliver the same power as the fluctuating amplitude.
The average value we need is called the
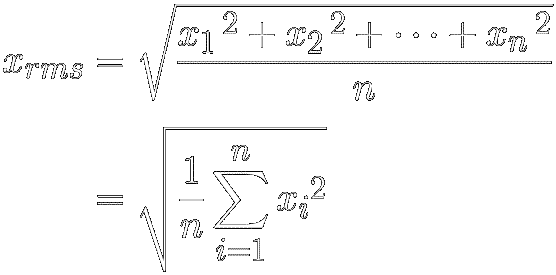
root-mean-square or RMS. It's defined
as the square root of the mean, or average, of a
sequence of squared amplitudes over time. In short, it's the root
of the mean squared amplitude :
|
|
[ 13 ]
|
|
Where:
x rms = the root mean square
n = the number of measurement values
x i = each value
It turns out that the RMS amplitude of a sine wave is equal to its peak amplitude ( V PK )
multiplied by about 0.707 ( 1 ⁄ √2 ).
Inversely, its peak amplitude is equal to its RMS amplitude multiplied by
about 1.414 ( √2 ). For example,
the peak voltage of a 120 VAC wall outlet is about 170 volts (120 × 1.414).
Decibel values are most often calculated using RMS-averaged power
or voltage values. Averaging is especially important when dealing with complex, non-repeating signals or noise.
|
|
Digital Audio |
|
Digital audio and analog audio exist in markedly different realms.
In the analog realm, an audio signal is a continuous,
smooth wave of a physical force, like acoustic pressure or electric voltage.
In the digital realm, however, an audio signal is a stream
of numbers ( or " samples " ), each
describing a single,
instantaneous level of force.
Each number in the stream is quantized
onto one step of a fixed staircase of levels having a
top step – a highest level –
called the clipping point.
For example, a 16-bit digital audio system has 216 = 65,536
(dubbed 64 K) numeric steps. Any signal voltage higher than the
top step can't be represented by the system and so its value gets clipped down to
the highest step.
The dBFS
Another name for the digital clipping point is
Full Scale. At full scale, an audio program's dynamic range
is using the entire bit depth
of the fixed-point digital system.
‘dBFS’ is a logarithmic
decibel ratio, referenced to the Full Scale clipping point. It measures how
many decibels below full-scale an audio signal is.
So, while analog signal levels are measured upward
from the noise floor, digital signal levels are measured downward
from the full scale level of 0 dBFS.
Dynamic Range
A signal voltage just barely higher than full
scale is necessarily clipped down to the highest digital step,
creating an error of one step. In a 16-bit system, a voltage error of one-step is a relative distortion of
1 ⁄ 65,536. In decibels, that's
20 × log (1 ⁄ 65,536) = −96 dBFS.
In other words, the maximum, unclipped dynamic range
of a 16-bit fixed-point system is 96 dB.
A 24-bit system has a dynamic range of 144 dB and a 32-bit
fixed-point system has a dynamic range of 1680 dB.
The dBTP (True Peak)
The digital music that's released for streaming, download, digital radio
or CD is a stream of numbers that are converted into a smooth wave by Digital-to-Analog Converters
(DACs) in our phones, cars, laptops,
Bluetooth speakers, CD players, etc.
The conversion of digital steps into a smooth
wave can result in changes to the audio level.
For example, the DAC may convert two adjacent, full-scale samples into a wave with a
true peak higher than either
sample peak (see figure).
These inter-sample peaks can result in audible
clipping if the DAC lacks sufficient analog headroom. Otherwise, they'll play back cleanly.
‘dBTP’ measures the
True Peak level of a signal.
Like dBFS, it's a logarithmic ratio referenced to the system's
full-scale clipping point. So,
0 dBTP = 0 dBFS.
But while dBFS values are negative, dBTP values are positive
(above full scale).
Some peak meters detect only sample peaks whereas a true-peak
meter uses oversampling and software algorithms to predict inter-sample peaks.
Peak metering can alert you to the dynamic range, headroom, and potential
digital clipping of an audio program, but it isn't a good measure of loudness.
Average sound levels
are a better measure of loudness than are instantaneous peak levels.
|
|
LUFS & LKFS |
|
‘LUFS’ and ‘LKFS’ are two different abbreviations for the
exact same method of measuring perceived
loudness. There's no difference
between the two and both are measured in
decibels
relative to full-scale.
In this article, we'll mostly use the abbreviation ‘LUFS’.
► The International Telecommunications
Union ( ITU ) first standardized this loudness measurement as LKFS,
an abbreviation of "Loudness K-weighted relative to Full Scale".
Later, the European Broadcast Union ( EBU ) standardized the same
measurement as LUFS, an abbreviation of "Loudness Units relative to Full Scale".
LUFS meters give us a more accurate measure of perceived
loudness than do either RMS or
peak meters.
They do this by taking into account two important characteristics of
our hearing :
-
its differing sensitivity to different sound frequencies and pressure levels, and
-
its correlation with average sound levels.
Both dBFS and LUFS are
measured in negative decibels
relative to full scale.
However, dBFS is a measure of signal strength
while LUFS is a measure of perceived loudness.
0 LUFS = 0 dBFS
As LUFS readings move more negative, the sound is perceived as quieter.
Loudness Units (LU)
LUFS loudness is an absolute measure even though it's relative to full scale,
just like the height of an airplane is an absolute measure even though its relative to Earth's surface.
The Loudness Unit ( LU )
was created as a relative loudness
(in decibels) that's equal to the difference between two LUFS levels.
For example, if a music streaming service has a loudness target of
−16 LUFS, then that target can be considered as 0 LU,
much like 0 VU
is considered a volume target in the analog realm.
By using −16 LUFS as a reference loudness :
●
−19 LUFS becomes −3 LU
●
−14 LUFS becomes +2 LU
K-Weighting
One improvement baked into the LUFS method is a frequency
weighting
filter called K-weighting.
K-weighting is the first step of
the LUFS method.
The following graph shows how K-weighting compares to the traditional A- and C-weightings.
|
|
‘K’ Weighting Curve compared to
‘A’ and ‘C’
LUFS meters K-weight audio signals so they more closely match the way we perceive loudness—with more
sensitivity to mid and high frequency signals and less sensitivity to low ones.
So, if a program has a lot of low bass content, LUFS
meters deemphasize it, lessening its contribution to the loudness readings.
▶ K-weighting is actually a
combination of a Pre-filter
that applies a 4 dB high shelf above 2000 Hz followed by a Revised Low-frequency
B-curve or RLB filter—a simple high-pass filter that applies a
2nd order rolloff below about 100 Hz.
Together, the two filters leave the frequencies between 100 Hz and 1000 Hz unchanged, at 0 dB.
▶ In a multi-channel program, K-weighting is
applied separately to each audio channel (Left, Right, Center, Left-Surround and Right-Surround).
Mean Squares, Channel Summing
After K-weighting the audio, the LUFS method computes the "mean-square" voltage
of each channel.
A mean square voltage is the average (mean) of the
squares of a succession of voltage measurements over a period of time. It's basically a
root mean square
(RMS), without taking the square root.
After the channels are mean-squared, they're summed together. 1.5 dB of gain is
added to each surround channel to simulate their position nearer to each side of the
listener than are the three front channels.
The mean-square voltages are then used to compute the RMS
power of the audio
over various durations.
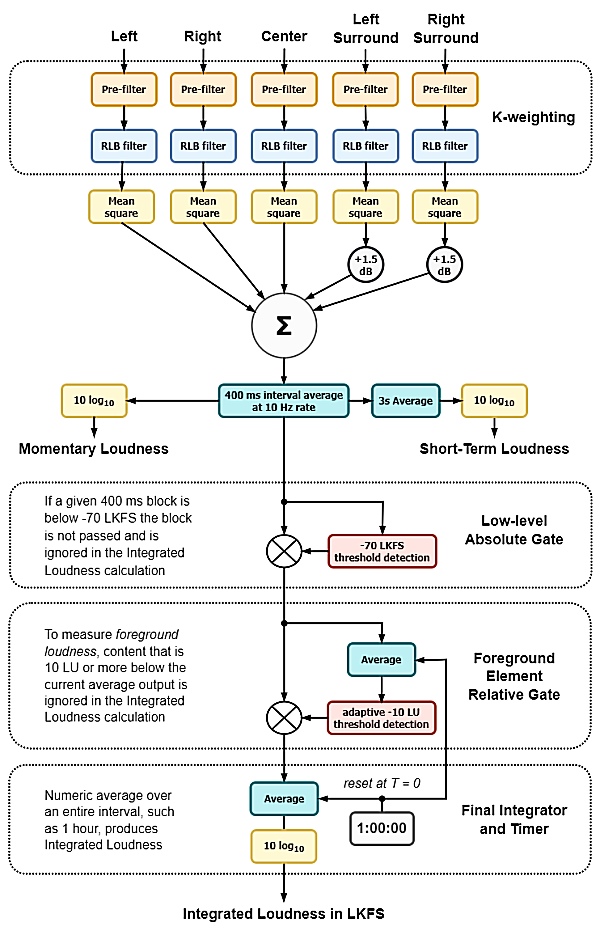
At this point, take a look at the following Flowchart to see how far
into the LUFS recipe we've gotten. We're just past the
channel summation.
LKFS / LUFS Loudness Measurement Flowchart
Momentary Loudness
After summing together all the audio channels, LUFS meters compute the
RMS average
power contained within
400-millisecond blocks of time.
One 400 ms time block
is averaged every 100 ms. This means that every new
time block overlaps the previous
block by 75%, ensuring that Momentary Loudness
readings transition smoothly :
LUFS Momentary Loudness Readings
► Recall that the ballistics of a d'Arsonval
VU Meter have an effective averaging time
of about 300 ms. So, Momentary LUFS is
somewhat similar to a traditional RMS meter, but with the addition of K weighting.
The final step to a LUFS "Momentary Loudness" is taking the
log10 of the current time block's frequency-weighted, RMS-averaged power,
and then multiplying by 10 to convert bels to decibels.
● Momentary Loudness is the foundation for two longer duration LUFS
measurements: Short-Term Loudness and Integrated Loudness.
Short-Term Loudness
A LUFS Short-Term loudness
reading is an average of the last
three seconds of Momentary
loudness readings.
Since momentary values are calculated 10 times per second, each
3-second-long short-term value is the average of a pool of 30 momentary
values.
Every 100 milliseconds, the newest momentary value is added to the
pool of 30 values and the oldest value is removed. Then, a new Short-Term
value is computed :
LUFS Short-Term Loudness Readings
This method, called a simple moving average,
is also used to chart financial data like stock prices and unit sales. The method
smoothes out momentary spikes in the data, helping to reveal trends that otherwise would be jittery.
The advantage of Short-Term LUFS readings is that they aren't overly affected by a few extra-loud, momentary peaks.
The final step to a LUFS
"Short-Term Loudness" is taking the
log10 of the most recent 3-second power average, and then multiplying by 10
to convert bels to decibels.
►
Since Short-Term LUFS react more slowly than Momentary LUFS,
True-Peak
metering is a good complement to Short-Term LUFS.
Integrated Loudness
LUFS Integrated Loudness is a
gated average of all the
Momentary Loudness
blocks within a long-duration time interval.
It can measure the loudness of an entire audio program,
be it a song; an album; a video;
a podcast; a TV/radio spot or episode; or a feature film.
There are two gates that
determine whether a particular 400 ms momentary time block is included in the
gated average, or else ignored for being too quiet :
- Low-Level Absolute
Gate
The first gate is a low-level, absolute gate having a fixed
threshold of
−70 LUFS. This gate keeps very quiet background
content from biasing the overall program loudness.
All the momentary blocks that measure below this threshold are ignored. They
will not contribute to the
integrated loudness.
- Foreground
Relative Gate
The second gate has a relative threshold that floats
higher or lower,
so as to focus on the foreground portion of the program.
The floating threshold is determined by averaging all the momentary blocks that
have successfully passed through the low-level gate, and then decreasing the result
by 10 LU ( loudness units ).
Any momentary blocks that measure below this floating threshold are ignored.
They, too, will not pass on to the final integrator.
Final Integrator and Timer
The Final Integrator arithmetically averages all the momentary
time blocks that have successfully passed through both the absolute and the
relative gates.
The starting time for this average is always "0" and the ending
time is some chosen duration.
Many LUFS meters run in real time,
continually updating the integrated loudness reading as new momentary blocks pass through the
gates. At the ending time, the timer is reset to zero.
The final step to displaying a LUFS "Integrated Loudness"
is taking the log10 of the most recent integrated power level,
and then multiplying by 10 to convert bels to decibels.
|
|
Loudness Normalization
|
|
LUFS Integrated Loudness has become the standard for maintaining loudness consistency
between individual pieces of audio, like songs, podcast episodes or spots in a newscast.
A consistent loudness level frees listeners from having to keep
readjusting the playback volume on
their devices.
Many media outlets use Integrated LUFS as their primary metric for
defining the loudness targets that perform best on their platforms.
Music streaming services will apply negative gain to songs that exceed the
service's target loudness and positive gain to songs that fail to reach the target.
They may also use
peak program levels
to help determine the amount of applied gain.
Matching songs to a target loudness is
called "Loudness Normalization"
Loudness normalization helps to ensure that
|
|
So… What's a Decibel ?
|
|
Okay, here are three Merriam-Webster™ style definitions of the
word ‘decibel’ for those occasions
when a short answer is needed to the question, "What's a decibel?" :
- A decibel is a unit for expressing sound pressure level (SPL) on a scale
from zero for the average least perceptible sound to about 130 for the
average pain level.
- A decibel (symbol dB) is a unit
for expressing the ratio of two amounts of acoustic or electric signal
power. One decibel equals ten times the common logarithm of this
ratio.
- A decibel (dB) is a unit for expressing the ratio of two amounts of
acoustic pressure or electric voltage. One decibel equals twenty times the
common logarithm of this ratio.
|

|